Human TNF-α ELISA Kit

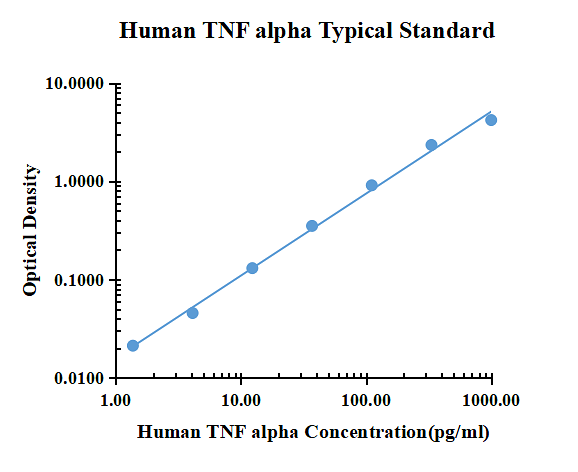
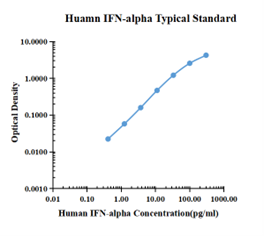
| pg/ml | O.D. | Average | Corrected | |
| 0 | 0.039 | 0.0402 | 0.0396 | |
| 1.37 | 0.0588 | 0.0628 | 0.0608 | 0.0212 |
| 4.12 | 0.0819 | 0.0885 | 0.0852 | 0.0456 |
| 12.35 | 0.1693 | 0.1712 | 0.1703 | 0.1307 |
| 37.04 | 0.3876 | 0.3956 | 0.3916 | 0.352 |
| 111.11 | 0.9071 | 0.9969 | 0.952 | 0.9124 |
| 333.33 | 2.4084 | 2.3694 | 2.3889 | 2.3493 |
| 1000 | 4.3651 | 4.1387 | 4.2519 | 4.2123 |
| Intra-assay Precision | Inter-assay Precision | |||||
| Sample Number | S1 | S2 | S3 | S1 | S2 | S3 |
| 22 | 22 | 22 | 6 | 6 | 6 | |
| Average(pg/ml) | 13 | 74.8 | 215.6 | 15.3 | 73.9 | 323.3 |
| Standard Deviation | 0.5 | 3.1 | 7.3 | 0.6 | 2.8 | 12.9 |
| Coefficient of Variation(%) | 3.7 | 4.1 | 3.4 | 4 | 3.8 | 4 |
Intra-assay Precision (Precision within an assay) Three samples of known concentration were tested twenty times on one plate to assess intra-assay precision.
Inter-assay Precision (Precision between assays) Three samples of known concentration were tested six times on one plate to assess intra-assay precision.
The spike recovery was evaluated by spiking 3 levels of human TNF alpha into health human serum sample. The un-spiked serum was used as blank in this experiment.
The recovery ranged from 95% to 105% with an overall mean recovery of 99%.
| Sample Matrix | Sample Evaluated | Range (pg/ml) | Detectable (%) | Mean of Detectable (pg/ml) |
| Serum | 30 | 0.63-3.85 | 100 | 2.08 |
Serum/Plasma – Thirty samples from apparently healthy volunteers were evaluated for the presence of IL-10 in this assay. No medical histories were available for the donors.
n.d. = non-detectable. Samples measured below the sensitivity are considered to be non-detectable.
 New Products


